
Wefarm
Project
Deshboard Design
Year:
2025
Role:
UX/UI Designer
A smart dairy farm monitoring system that provides clear data, real-time alerts, and advanced filtering by key metrics such as weight, feeding, and drinking. It helps detect issues early, save time and resources, and ensure proper care for every cow-keeping the farm efficient and under control.
Without guesswork and with greater control Our vision is to make dairy-farm management smarter, simpler, and more effective. With a modern system that provides real-time control over herd health, nutrition, and productivity, we make data-driven management accessible to every farmer-without spreadsheets, guesswork, or unexpected issues.
01 THE CHALLENGE
The main challenge was to transform a complex and high-pressure farm environment into a clear digital interface that helps create order. Farmers need to track feeding, health indicators, reproduction, anomalies, and overall farm operations from multiple data sources. The goal was to organize all the information in one place, simplify workflows, and help farmers stay in control without disrupting their daily routine.

02 THE PROBLEM
The core problem is the inability to detect real-time changes or health issues in individual cows. With a heavy workload and manual monitoring that simply isn’t feasible, many farmers identify illnesses or abnormal conditions too late - leading to reduced productivity, higher treatment costs, and in some cases, serious risk to the animals’ well-being. There is a need for a solution that provides early alerts, highlights anomalies clearly, and enables immediate action that minimizes damage and improves the farm’s overall profitability.
03 THE PROJECT GOALS


04 COMPETITOR RESEARCH
Digital platforms for managing cattle farms (mainly dairy), including a mobile app and a web portal. The systems focus on herd management and allow farmers to track milk production, herd health, reproduction, nutrition, and feeding plans. In addition, they store historical data for each cow, provide smart alerts, use AI tools for data analysis, and generate reports that support decision-making and efficient farm management.
05 RESEARCH CONCLUSIONS
Each system integrates AI
More convenient tablet access for farmers
Farmers are looking for clear and simple systems
Both systems offer payment by usage, package plans, or an annual subscription
06 BUSINESS MODEL


07 BUSINESS GOALS
To position the product as a leader in the agricultural sector
Positioning
1
Increase the customer base
Expansion
2
Retention of existing customers
Retention
3
08 AI
The system integrates an AI tool with smart sensors attached to the cows, collecting real-time data on activity, feeding, and behavior. By analyzing these patterns, the system detects irregularities and provides early alerts about potential health issues, helping farmers manage the herd and make data-driven decisions.

09 User Research
“I’ve got 350 cows on my head - I can’t also spend all day chasing reports and Excel sheets.”
Shmuel, 61 years old, married, owns a large farm in northern Israel with about 350 cows. He has 27 years of experience in the field and manages the farm via a tablet, with a moderate level of technological literacy.
10 SYSTEM TREE

11 WIREFRAMING

11 WIREFRAMING
12 Design
#052F1B
#D4ED6D
#26D560
#024653
Typography

Icons


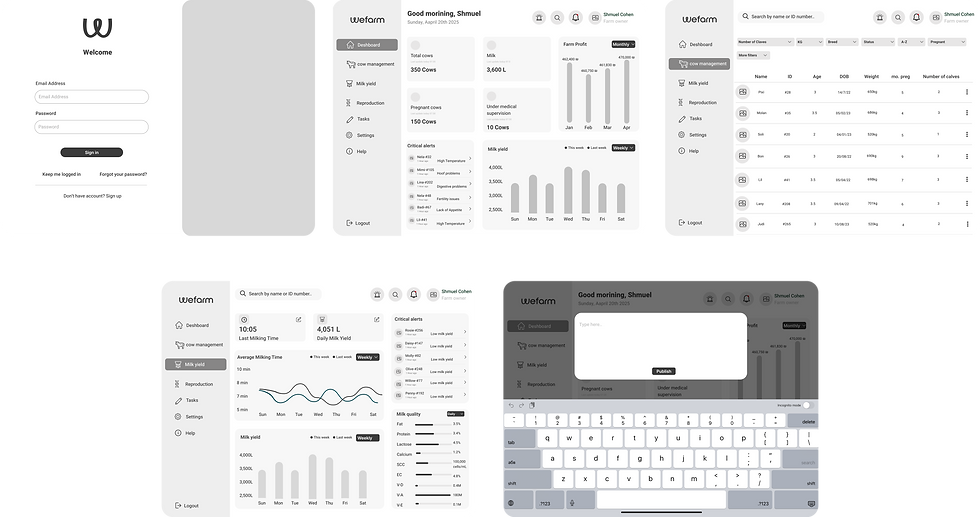
13 Design tablet
Home Screen:
The home screen provides a real-time overview of the farm’s status. It displays key data such as the total number of cows on the farm, overall milk production, the number of pregnant cows, and how many cows are currently under medical treatment. The dashboard also presents milk revenue by month with the option to filter by year, highlights important alerts and irregularities, and shows milk production performance with comparisons across different time periods to help track trends and performance.

Cows List Screen:
This screen displays a complete list of all the cows on the farm. Users can easily browse and manage the herd, with the ability to filter cows by different criteria such as breed, weight, pregnancy status, and additional attributes. This allows farmers to quickly locate specific cows and organize the herd according to their needs.

Cow Profile Screen:
This screen shows key health data for a selected cow, including heart rate, oxygen levels, weight, blood pressure, and other vital indicators. All data is collected in real time via sensors. It also displays the cow’s location on the farm map and step count to monitor activity and health.

Milk Production Section:
This section shows the cow’s last milking time and the amount of milk produced. It includes details on milk quality and components, such as vitamins, milking times, and weather conditions. Weather stability is also considered, as more stable conditions usually lead to higher and more consistent milk production.

Pregnancy Data:
This screen shows the cow’s pregnancy status, including the last check-up date, current pregnancy month, and key related details. It also includes nutritional data such as calorie intake, carbohydrates, and fats to help monitor the cow’s health and ensure a healthy pregnancy. Additionally, farmers can log and track completed tasks in a dedicated table.

Task Updates:
When clicking on one of the tasks, farmers can update the information manually. This allows them to report if something unusual occurred or confirm that everything is normal and the task was completed as expected.

Milk Production screen:
This Screen allows farmers to monitor the level and quality of milk production on the farm in real time. The screen displays the last milking time of all cows, the total number of liters collected during the day, the average milking duration, and the milk quality. In addition, the system highlights cows with unusually low milk production, enabling farmers to quickly identify potential issues and respond accordingly.

Pregnancy Overview Screen:
This screen provides a comprehensive view of all pregnancy data across the farm. It shows how many cows are currently pregnant, how many new pregnancies have been detected, which cows are at risk during pregnancy, and additional relevant insights.
THANK YOU !
SAY HEY